| North Richmond | Windsor | |
|---|---|---|
| Mar 2012 | 7.5 | 6.5 |
| Mar 2013 | 6.0 | 5.6 |
| Jun 2013 | 7.4 | 6.5 |
| Apr 2015 | 5.2 | 5.2 |
| Jun 2016 | 6.4 | 5.9 |
| Feb 2020 | 11.5 | 9.4 |
| Mar 2021 | 14.4 | 12.9 |
| Mar 2022 | 14.1 | 13.7 |
| Apr 2022 | 10.2 | 9.0 |
| Jul 2022 | 14.2 | 13.9 |
| Oct 2022 | 8.1 | 7.4 |
| Apr 2024 | 10.4 | 9.4 |
| Jun 2024 | 10.1 | 8.7 |
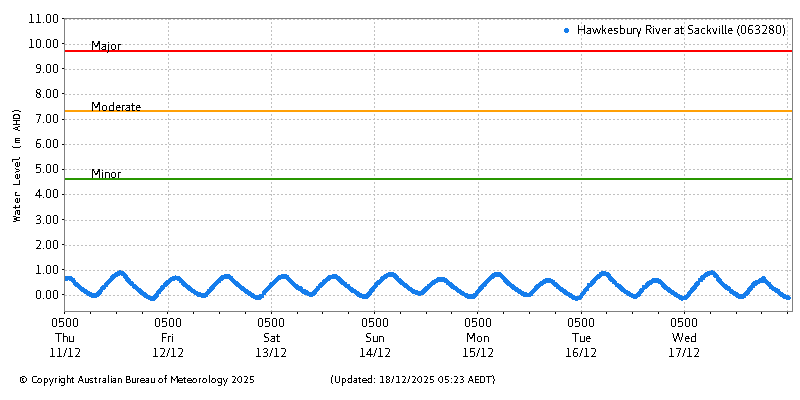
Historical river level data is sourced from the Bureau of Meteorology’s Water Data service.